Your wealth lives in 12 PDFs,
3 brokerages, and a spreadsheet.
Nagare puts it in one place — and an AI agent does the bookkeeping.
Private funds, directs, public accounts, credit lines. One truthful dashboard, kept current from the documents you already receive.
You'll know in 30 minutes whether it fits.
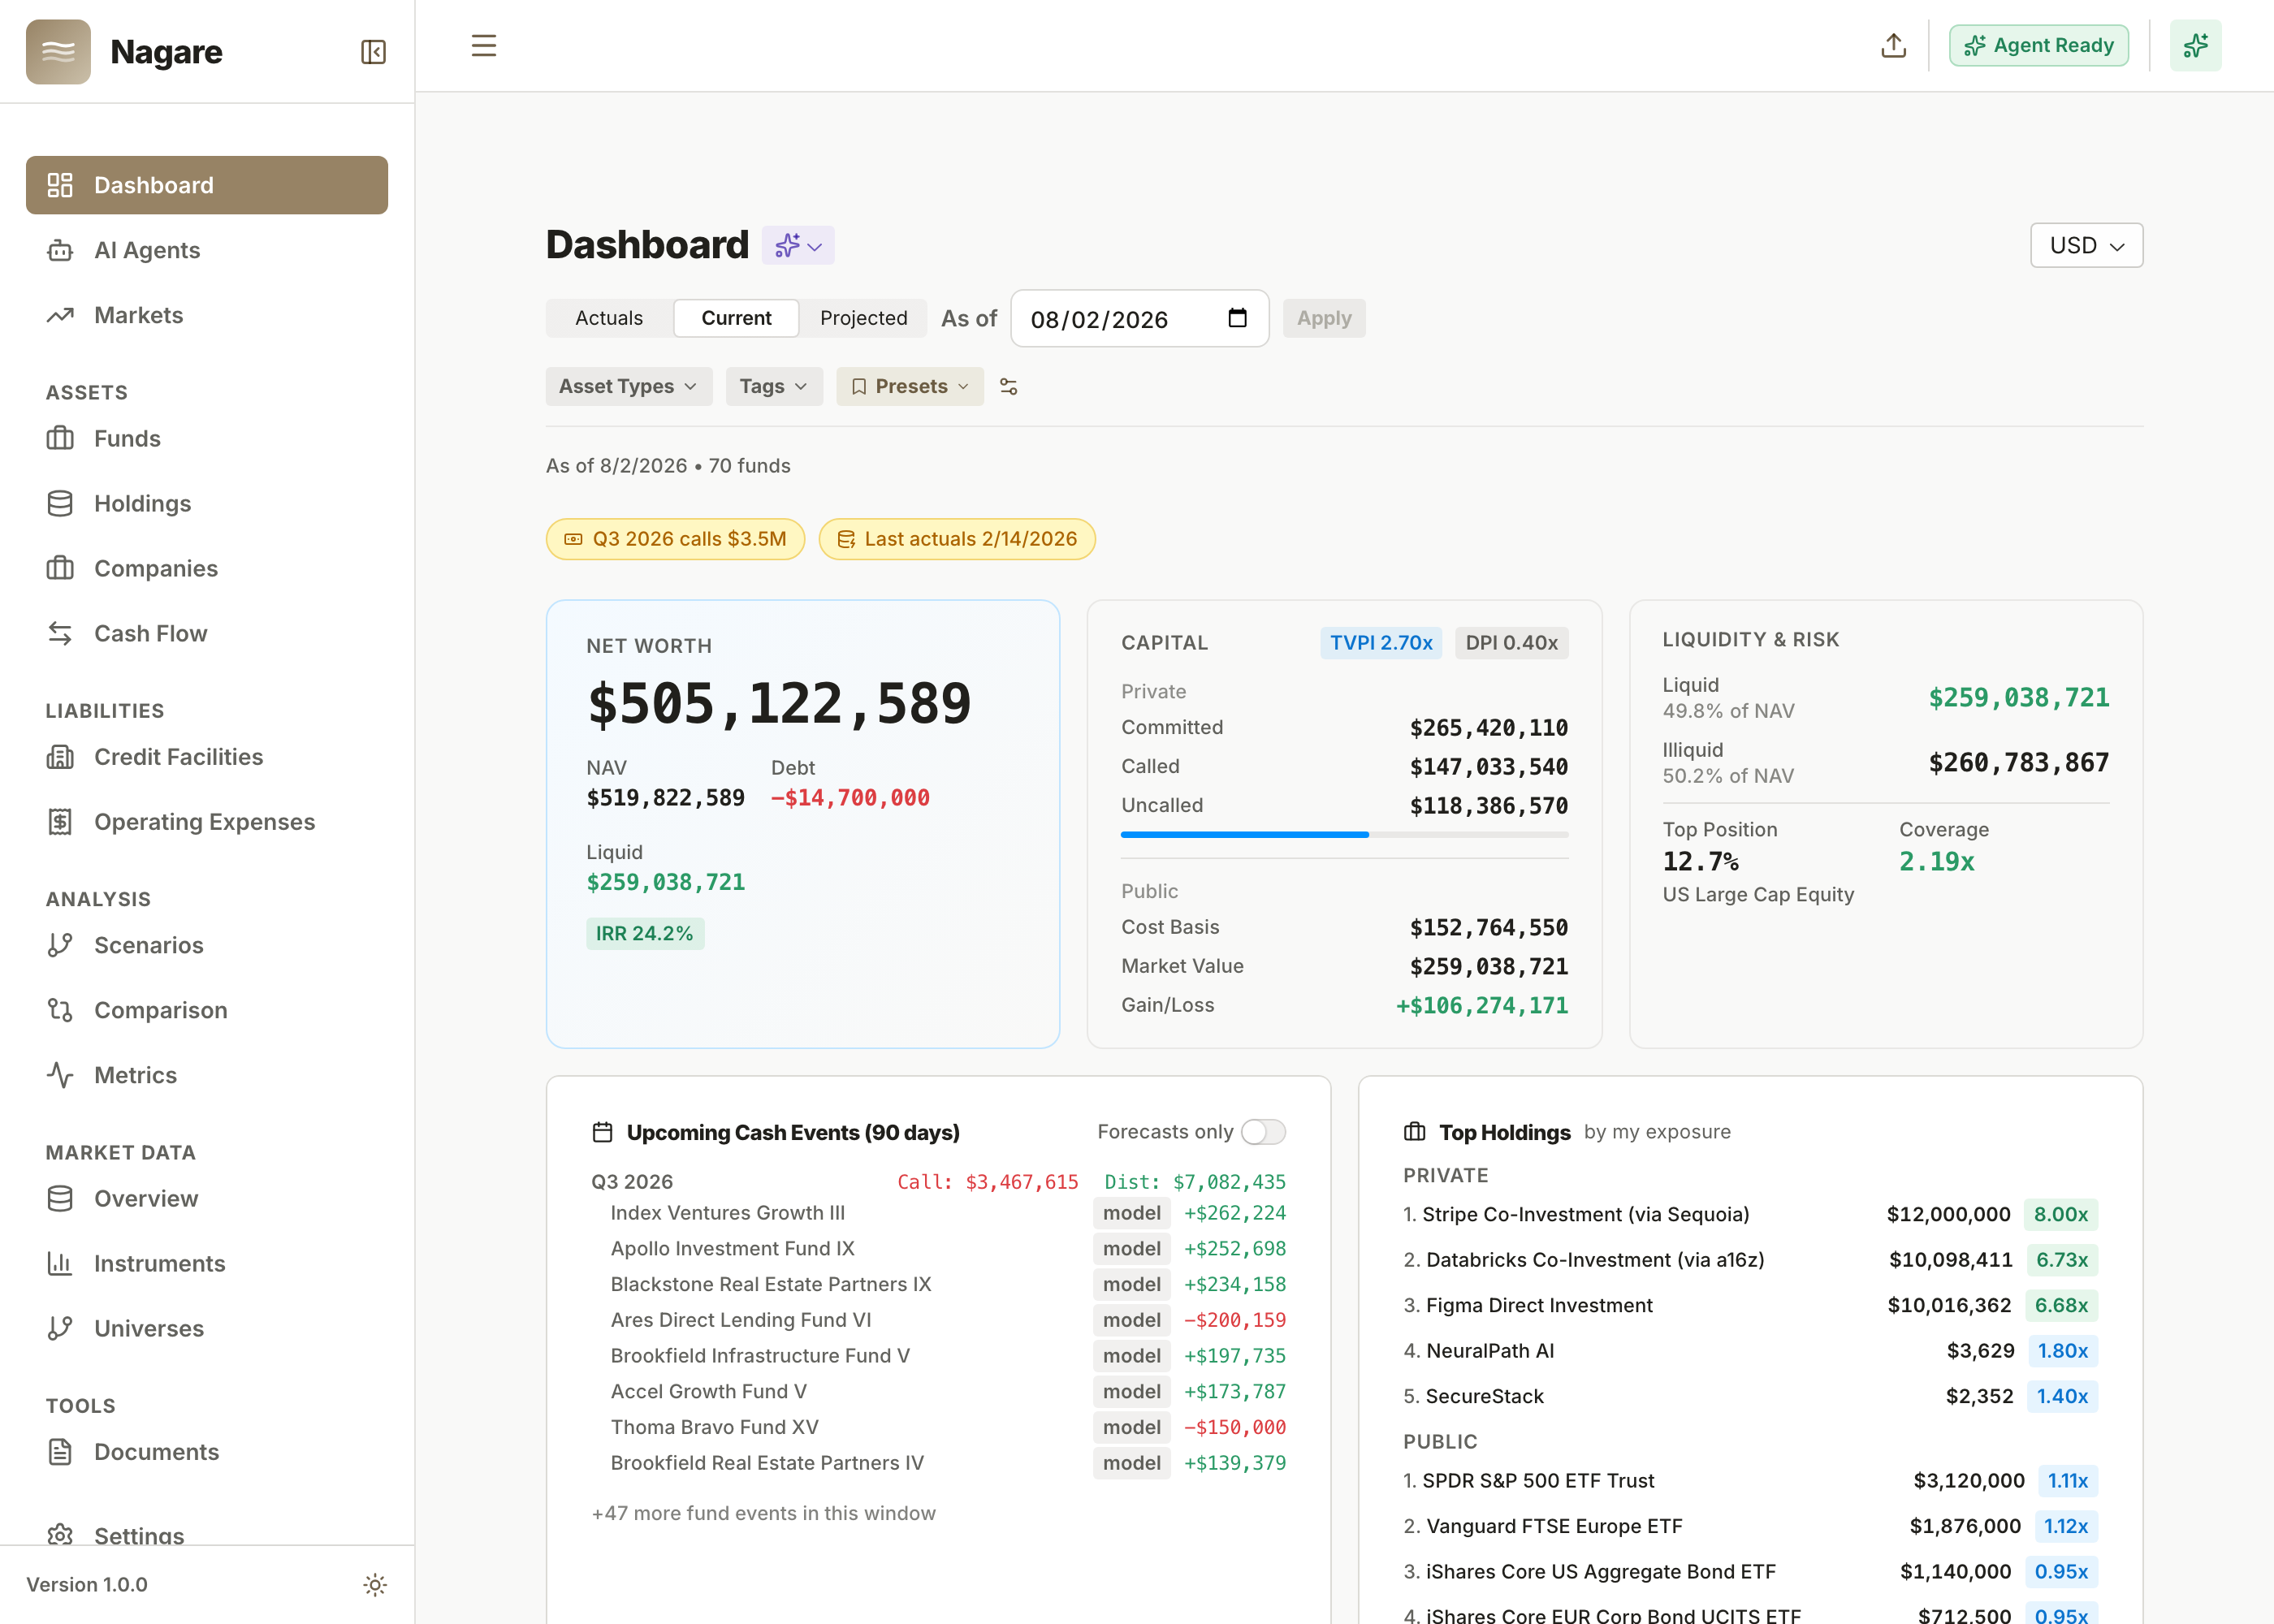
Everything you own. One place.
Not another reporting tool bolted onto one asset class. The whole balance sheet.
Private funds
VC, PE, growth. Commitments, capital calls, distributions, NAV — and look-through to the underlying holdings.
Directs & SPVs
Direct investments and SPVs tracked alongside your funds, not in a separate spreadsheet.
Public portfolios
Brokerage and 401k statements ingested automatically. Holdings, cost basis, performance.
Credit & leverage
Credit facilities, lombard lines, and maturities — so your net worth is net, not gross.
Multi-currency net worth
USD funds, EUR accounts, CHF credit lines. One number, converted correctly.
Projections
Deterministic and Monte Carlo scenarios, calendar-aligned across funds, anchored on your real cashflow history.
The agent does the bookkeeping.
The reason portfolio trackers fail is data entry. Nobody re-keys 40 quarterly reports forever. So Nagare's agent does it.
Reads your fund documents
Quarterly reports and capital account statements go in. Capital calls, distributions, NAV updates, and holdings come out — as proposed entries you approve.
Keeps the data current
New statement, new mark, new FX rate — the portfolio updates. No quarterly re-keying session.
Reconciles look-through vs official NAV
When the sum of underlying holdings drifts from the GP’s reported NAV, you see it — with the gap quantified.
Answers questions
“What’s my unfunded across 2021 vintages?” “Which funds called capital last quarter?” Ask in plain English, get answers from your data.
The dashboard opens with what changed.
Not a wall of charts. The first screen tells you what moved and what needs your attention:
- Capital calls due — and where the cash will come from.
- Maturities approaching — credit facilities and terms that need a decision.
- Stale data flagged — which marks are old, which statements are missing, and what that does to the numbers.
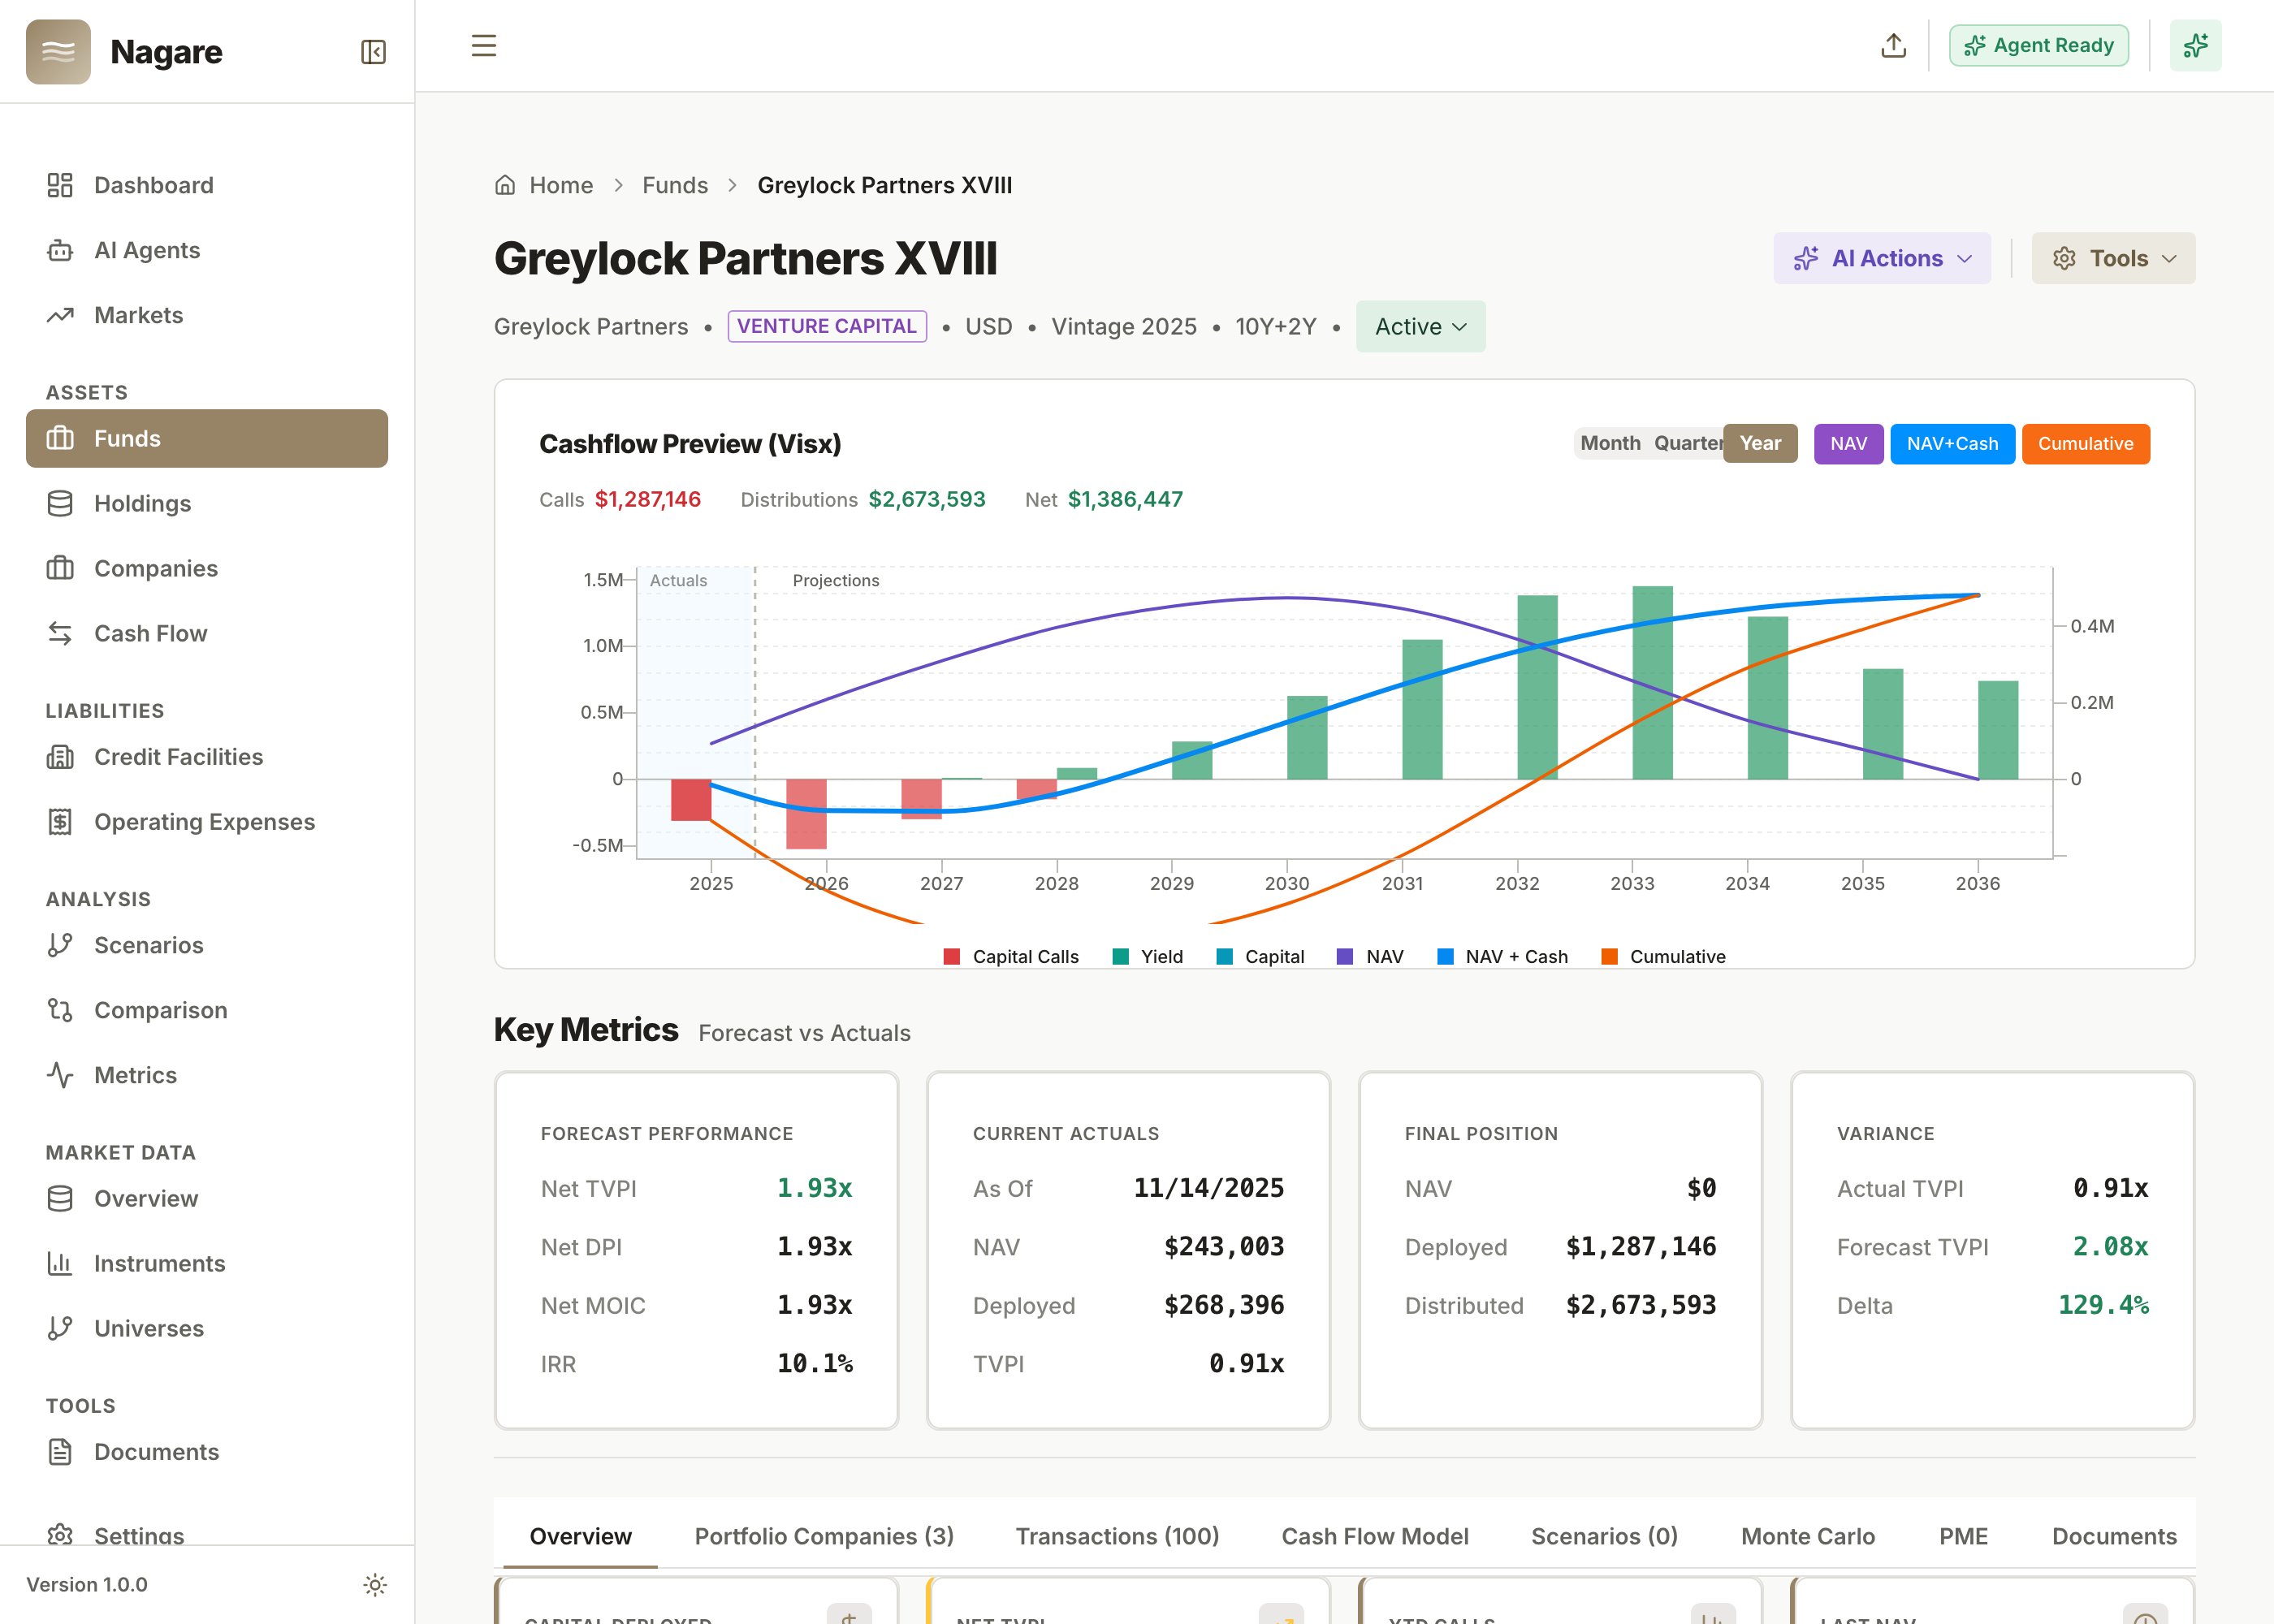
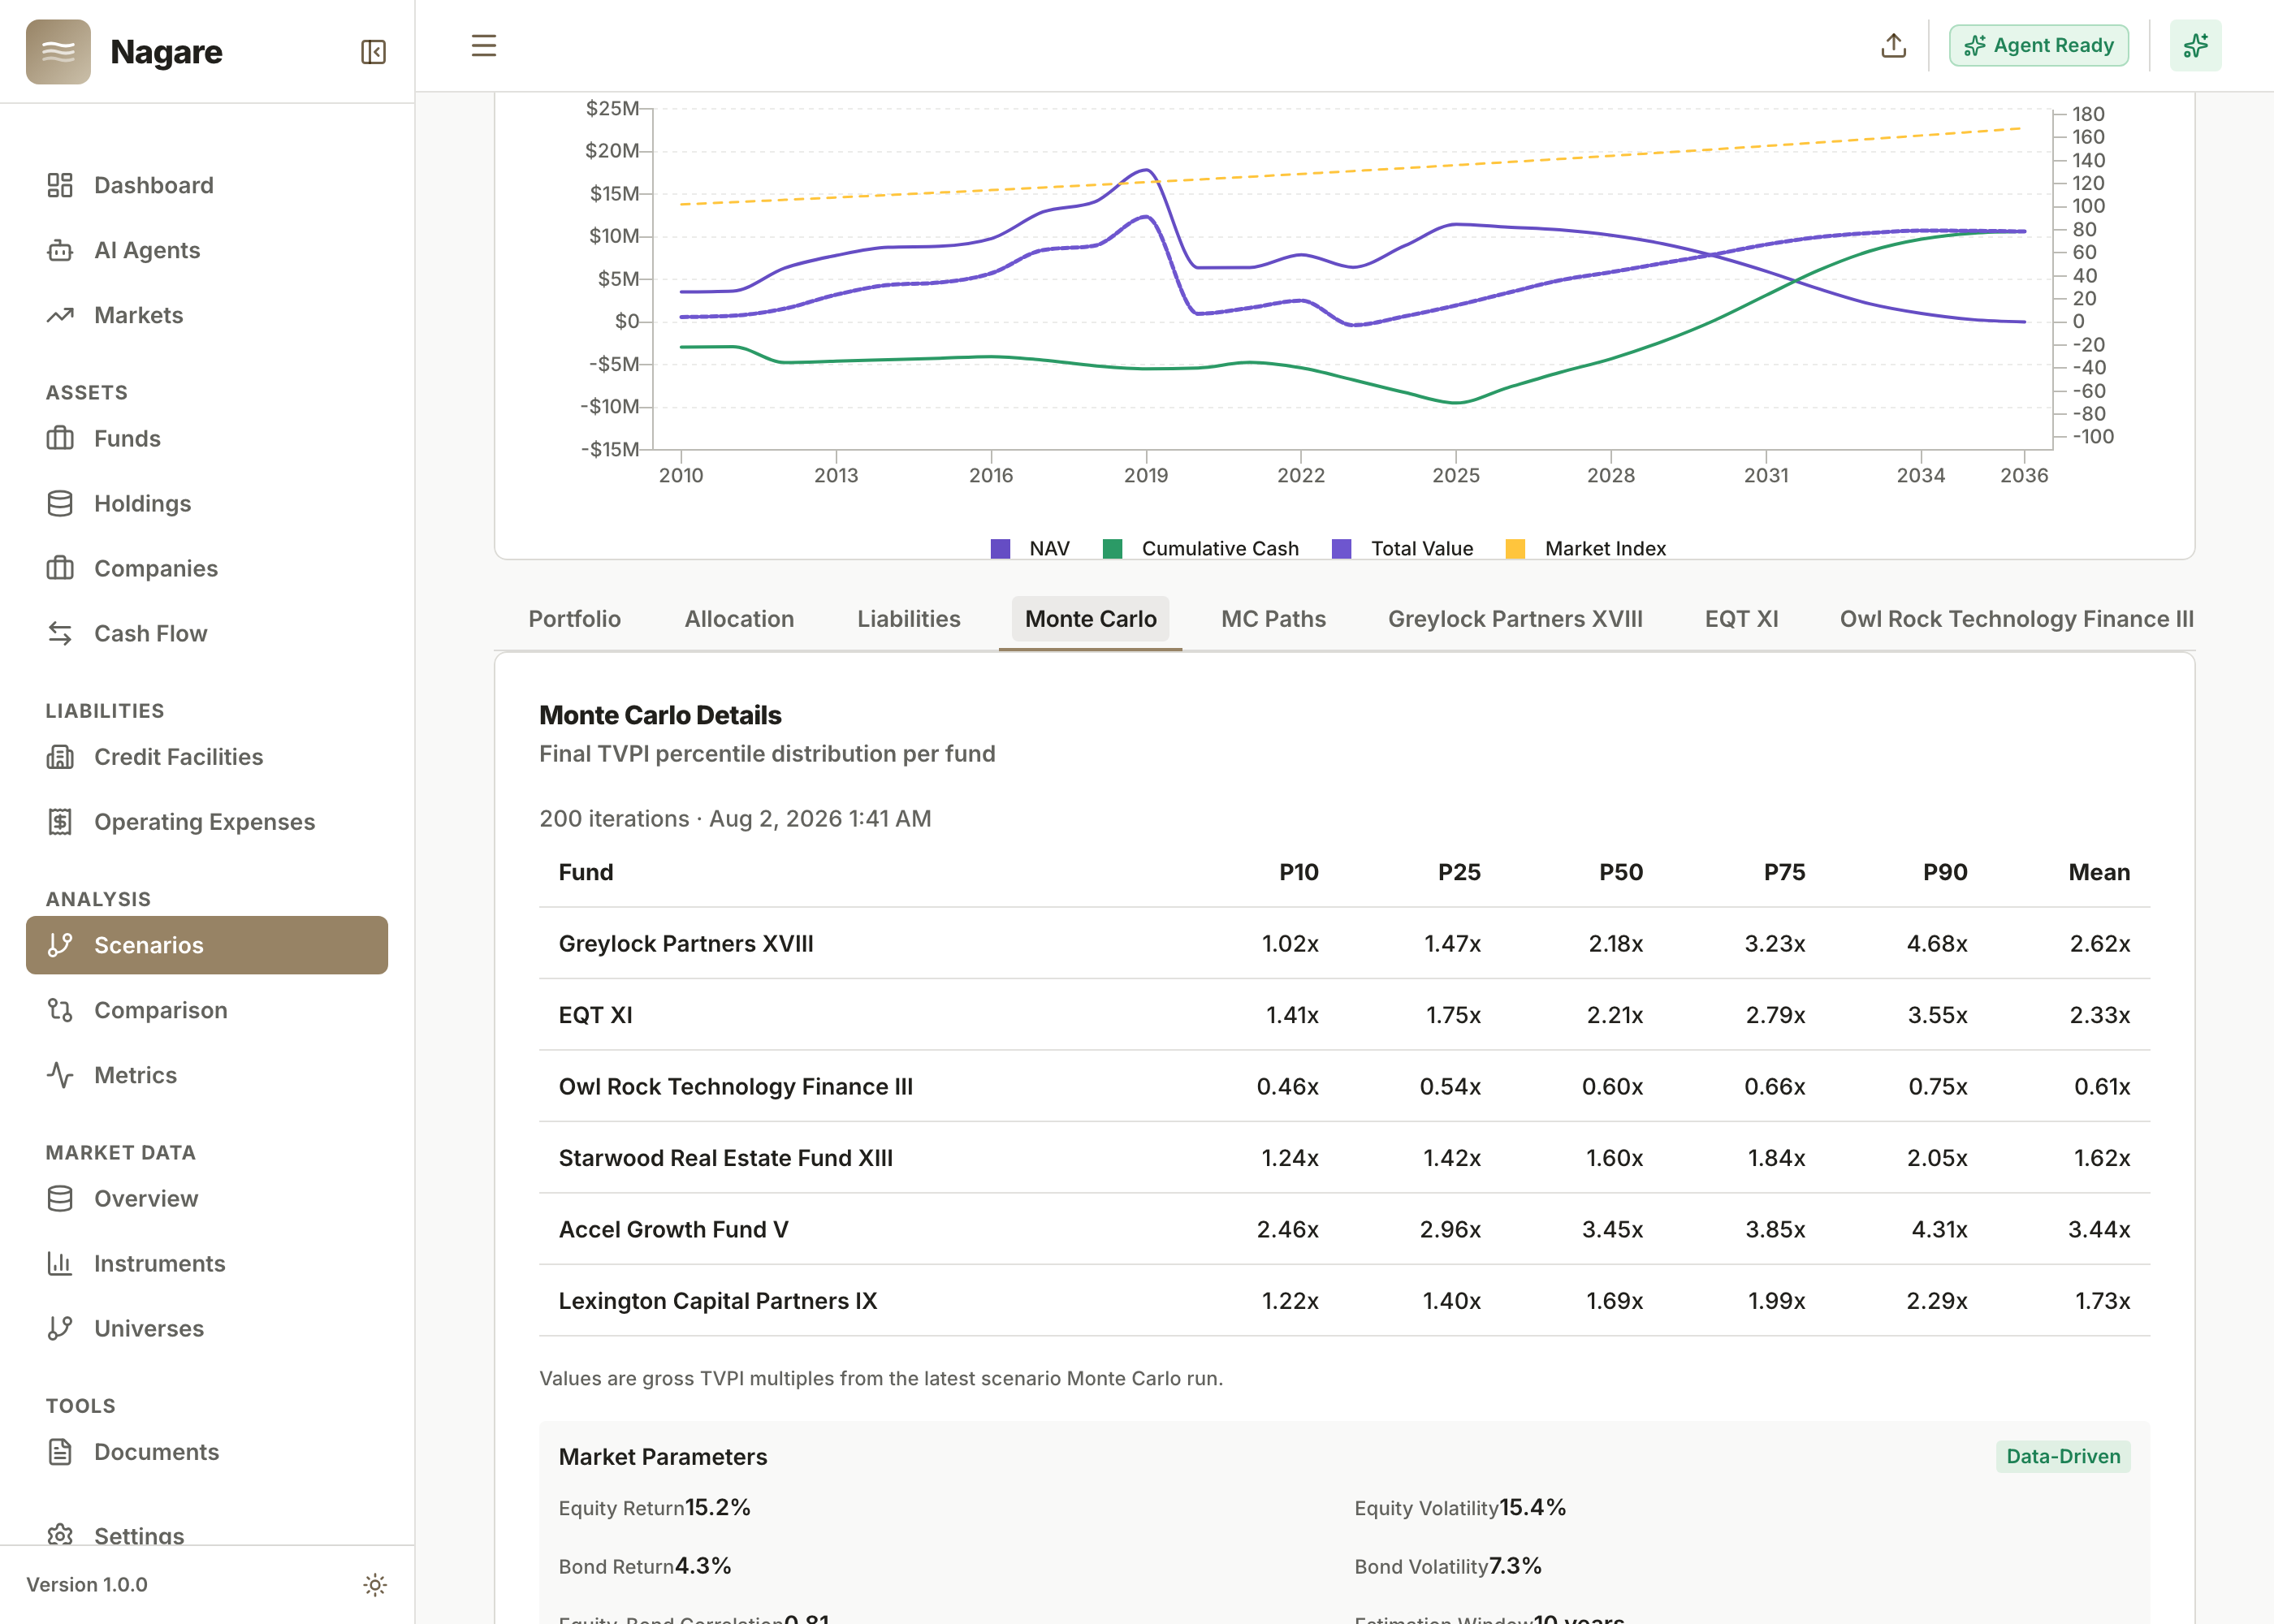
See the next 5 years, not just the last quarter.
Every fund projects its remaining calls and distributions on a shared calendar, anchored on your actual cashflow history — so you see the quarter when three funds call capital at once, before the GPs do.
- Deterministic scenarios — base, bull, bear, and your own, in seconds.
- Monte Carlo — market-linked simulations with P10/P50/P90 outcomes you can trace back to assumptions.
- Commitment modeling — “Can I commit $15M?” answered with NAV impact and liquidity need, same day.
Who it's for
Family offices
10–50 fund commitments plus directs, public accounts, and credit lines. One system instead of five.
Private investors
Serious LPs who want their whole net worth — not just one asset class — current and queryable.
Fund-of-funds
Look-through across 100+ underlying funds, with scenario planning for deployment and liquidity.
Not for you if Excel still works for your 2–3 funds. See when it stops working →
One dashboard. Zero re-keying.
Bring one fund statement to the demo. Watch the agent read it.