Working with Marks That Arrive 6-9 Months Late
Your Q2 2025 capital statement arrives in October 2025.
It shows NAV as of March 31, 2025.
You need to make a commitment decision today (October 15, 2025).
The NAV you're looking at is 7 months old.
This is the reality of private markets. GPs take time to value portfolios, audit financials, and produce statements. By the time you get them, they're historical documents.
For tax reporting and historical analysis? Perfect.
For making decisions about where to deploy capital next? Not helpful.
Here's how to think about stale marks and what to do about them.
Why Marks Are Always Late
The private markets reporting cycle:
| Event | Timing |
|---|---|
| Quarter ends | March 31 |
| Portfolio companies report to GP | April-May |
| GP values portfolio | May-June |
| GP produces capital statements | July-August |
| You receive statement | September-October |
| Data age when you see it: | 6-7 months |
This isn't anyone's fault—it's the nature of private assets. You can't mark-to-market like public stocks because there's no market.
But it creates a planning problem.
The Planning Problem
You're trying to answer forward-looking questions with backward-looking data:
Question: "Should we commit $5M to this new manager?"
What you need to know:
- Current PE allocation
- Available liquidity over next 2 years
- Portfolio concentration risk
What your marks tell you:
- PE allocation as of 7 months ago
- Cash balance as of 7 months ago
- Portfolio composition as of 7 months ago
A lot changes in 7 months:
- Capital calls reduced your cash
- Distributions increased your cash
- Public markets moved 10-15%
- Currency rates shifted
Making decisions on 7-month-old data is guessing.
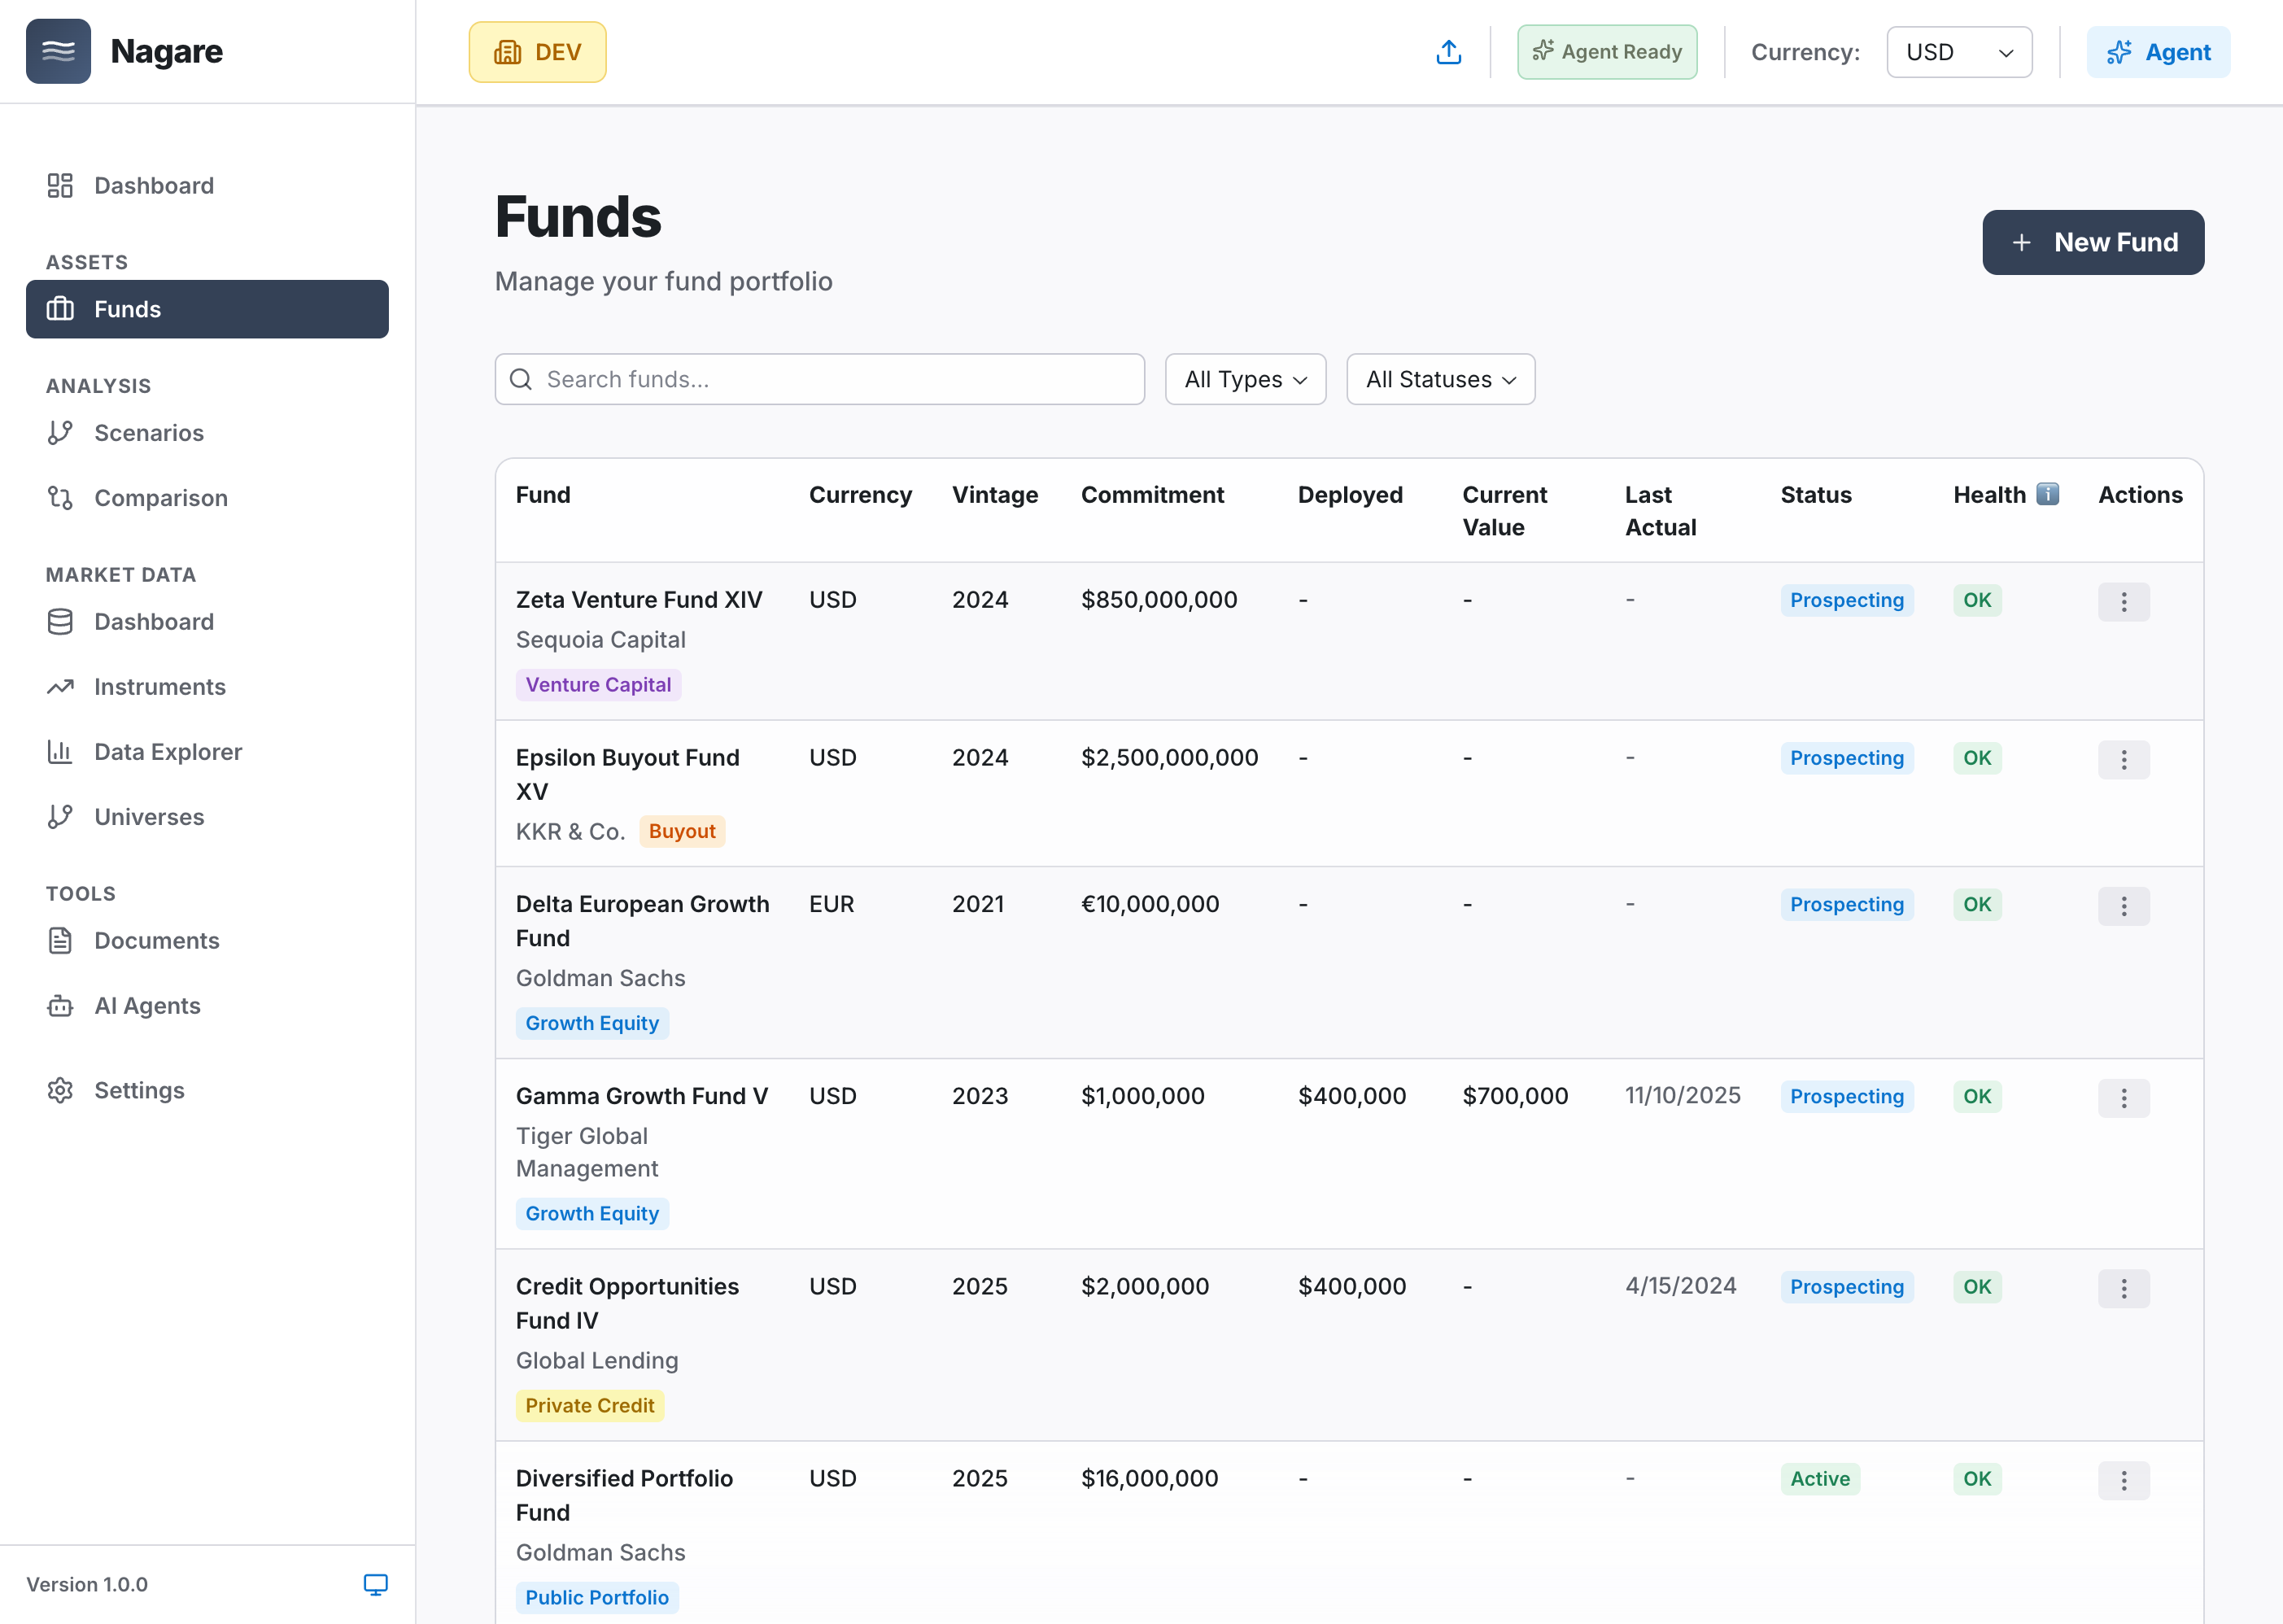 Manage multiple private funds in one portfolio view - track actuals and project forward
Three Approaches to Handle This
Approach 1: Use Actuals Only (What Most People Do)
How it works: Use the latest marks exactly as reported. Acknowledge they're stale. Make decisions anyway.
Pros:
- Simple
- No modeling required
- Accurate historical record
Cons:
- Terrible for planning
- Forces you to guess at current position
- Can lead to bad decisions (over-committing because you don't know real liquidity)
When to use this:
- Reporting to LPs
- Tax filings
- Historical performance analysis
- When you're not making forward-looking decisions
Example: "Our PE portfolio NAV was 5M based on Q1 data."
Problem: What if your Q2 capital calls were 3M? Your actual cash position is materially different than Q1 showed.
Approach 2: Simple Forward Projection (Better)
How it works:
- Start with latest marks
- Apply a growth rate assumption
- Project to today
Example:
- Q1 2025 NAV: $120M (as of March 31)
- Assume 10% annual growth
- Project to October 15: 126M
Pros:
- Gives you current estimate
- Better than using stale marks
- Quick to calculate
Cons:
- Oversimplified
- Doesn't account for cashflows (capital calls, distributions)
- Doesn't capture fund-level dynamics
- Ignores fees, currency, actual fund performance
When to use this:
- Quick directional checks
- Back-of-envelope estimates
- When you just need "roughly current" NAV
Example: "Our PE portfolio was 126M today. Good enough for this decision."
Problem: This ignores 8M in distributions that happened. Your real NAV is probably 126M.
Approach 3: Fund-Level Projections (What We Use)
How it works: Model each fund individually from last mark to today:
- Start with last reported NAV per fund
- Add fund-specific cashflows:
- Capital calls (based on deployment schedule)
- Distributions (based on exit timing)
- Management fees (based on fee schedule)
- Apply fund-specific growth:
- Early stage: Higher growth as companies scale
- Late stage: Lower growth as exits approach
- Handle currency:
- Track source currency
- Convert at current FX rates
- Roll up to portfolio
Pros:
- Much more accurate
- Captures actual cashflows
- Reflects fund-level dynamics
- Useful for planning
Cons:
- Requires fund-level modeling
- More complex than simple projection
- Needs good assumptions per fund
When to use this:
- Making commitment decisions
- Liquidity planning
- IC preparation
- Portfolio rebalancing
Example:
Fund A (Venture, Year 3):
- Q1 NAV: $5M
- Q2-Q3 capital calls: $2M
- Q2-Q3 growth at 15%: +$0.8M
- Q2-Q3 fees: -$0.1M
- Current NAV: ~$7.7M
Fund B (Buyout, Year 8):
- Q1 NAV: $15M
- Q2-Q3 distributions: -$5M
- Q2-Q3 growth at 8%: +$0.8M
- Q2-Q3 fees: -$0.2M
- Current NAV: ~$10.6M
Portfolio Total:
- Q1: $120M
- Current (projected): $121M
Now you have a current view that accounts for actual fund dynamics.
What You Actually Need
Here's the framework I use:
For Reporting: Use Actuals
When reporting to LPs, use the exact marks as reported. Don't project forward.
LP wants to know: "What was our NAV at quarter-end?" Answer: "It was $120M as of March 31, per GP statements."
For Planning: Use Projections
When making decisions, use fund-level projections to get current view.
IC asks: "What's our current PE exposure?" Answer: "It was 121M today."
For Risk Management: Use Monte Carlo
When you need confidence bands and tail risk analysis.
Risk committee asks: "What's the probability our NAV drops below 105M in downside scenarios."
Practical Implementation
What You Need to Project Forward
Per fund, you need:
- Latest reported NAV
- Deployment schedule (how fast are they calling capital?)
- Distribution assumptions (when do exits start?)
- Growth assumptions (what's the portfolio appreciating at?)
- Fee schedule (management fee, carried interest terms)
- Currency (source currency and FX rates)
Where to Get These
Deployment schedule:
- Look at historical capital call pattern
- Check fund's remaining commitments
- Adjust for fund stage (Year 2 = active deployment, Year 8 = minimal)
Distribution assumptions:
- Check fund's exit timing expectations
- Look at comparable funds
- Adjust for market conditions
Growth assumptions:
- Use historical performance
- Adjust for fund stage (early stage grows faster)
- Consider current market environment
Fee schedule:
- Stated in fund documents
- Usually 2% on committed or invested capital
- Track whether it's on commitments or NAV
Currency:
- Stated in capital statements
- Track original currency and current FX rate
How Often to Update
Quarterly: When new marks arrive
- Update baseline (latest marks)
- Refresh forward projections
Monthly: For active decision-making
- Update FX rates
- Adjust growth assumptions if market moved significantly
Ad-hoc: When evaluating new commitments
- Run scenario with hypothetical new fund
- See impact on current projections
Common Mistakes
Mistake 1: Using Stale Marks for Liquidity Planning
"We have 10M."
Problem: Q2-Q3 capital calls might have been 5M left.
Solution: Project cashflows forward before making commitment decisions.
Mistake 2: Over-Projecting Growth
"Our Q1 NAV was 130M."
Problem: You're ignoring capital calls, distributions, fees. And 15% might be optimistic.
Solution: Model cashflows explicitly. Be conservative on growth assumptions.
Mistake 3: Treating Projections as Facts
"Our current NAV is exactly $126,342,891."
Problem: False precision. You're working with estimates and assumptions.
Solution: Use ranges. "Current NAV is approximately 123.5M."
Mistake 4: Not Updating Assumptions
"We projected 10% growth in January, so we'll keep using that."
Problem: Market moved, your funds' portfolios changed, currency shifted.
Solution: Review assumptions quarterly. Adjust based on actual performance and current conditions.
The Bottom Line
Stale marks are reality in private markets.
You can't change when statements arrive.
But you can change how you use them.
For historical reporting: Use actuals exactly as stated.
For forward planning: Project to current using fund-level assumptions.
For decision-making: Understand you're working with estimates, not certainty.
The goal isn't perfect precision—it's good enough to make informed decisions instead of guessing.
Want to see how fund-level projections work for your portfolio? Schedule a demo and we'll walk through your actual funds.
Ready to Transform Your Portfolio Management?
See how Nagare can eliminate manual work and accelerate decision-making.
Related Articles
The $2M Reconciliation Error That Changed How We Think About Cash
A single missed transaction created a $2M hole in a client's cash forecast. We rebuilt our system so it can never happen...
Stop Chasing Spreadsheets: Introducing Agent Schedules
Manual portfolio monitoring at scale is impossible. Our new Agent Schedules feature deploys 6 AI agents that run 24/7, c...