Why I Built a Forward-Looking Portfolio Model (And Why Excel Wasn't Enough)
After your 15th private fund commitment, something changes.
You have good managers. You have a thesis. You're building a portfolio deliberately.
But you can't answer basic questions anymore:
- Where will we land in 3 years? 5 years?
- When can I commit to the next manager?
- What's the impact of adding this $5M commitment?
- What's my true PE exposure right now?
The problem isn't that you don't have data. It's that the data you have doesn't tell you where you're going.
The Stale Marks Problem
Your Q2 2025 capital statement arrives in October 2025. It shows NAV as of March 31, 2025.
You're making commitment decisions in October based on 7-month-old data.
For historical reporting? Fine.
For planning your next move? Useless.
What I Tried First: Excel
Like everyone, I started with spreadsheets.
One sheet per fund. A master rollup. Manual data entry from PDFs.
It worked fine for 5 funds. Manageable at 10 funds.
At 15+ funds, it became fragile:
The version control problem:
- master_model_v3.xlsx
- master_model_v3_final.xlsx
- master_model_v3_final_ACTUAL.xlsx
- Which one has the correct numbers?
The formula problem:
- 200+ VLOOKUP functions
- Nested IFs 5 levels deep
- One misplaced parenthesis breaks everything
- Nobody can debug it 6 months later
The "adding a fund" problem:
- New fund commitment?
- Copy another fund's sheet, update formulas
- Break 3 references in the master rollup
- Spend 2 hours fixing it
The manual entry problem:
- 15 funds × 4 quarterly reports = 60 PDFs/year
- Type NAV, capital calls, distributions, fees
- 1-2% error rate means 1-2 errors per quarter
- Find them? Good luck.
No Monte Carlo:
- Build 3 scenarios manually (base, upside, downside)
- Want to see probability distributions?
- Not happening in Excel.
The Questions I Couldn't Answer
"Where will we land in 5 years?"
I could tell you where we were 7 months ago (last marks).
I couldn't tell you where we're going.
The marks are a lagging indicator. They tell you what your NAV was in Q1. They don't tell you what it'll be in 2028.
To plan new commitments, I needed to know: "If I add $5M to this manager, what does my 2028 portfolio look like?"
Excel answer: "Give me 3 days to rebuild the model."
"When can I commit again?"
Liquidity planning with stale marks is guessing.
I needed to know:
- When are capital calls coming? (Not just historical averages)
- When are distributions coming? (Fund-by-fund, not portfolio-level guess)
- How much dry powder do I need? (Quarterly cashflow, not annual aggregates)
Excel answer: "Let me manually forecast each fund's cashflows, sum them up, and hope I didn't miss anything."
"What if we do this deal?"
IC meeting. Manager presents. Great opportunity.
IC asks: "What's the impact if we commit $5M?"
I need to show:
- New allocation mix
- Liquidity impact (when do they call capital?)
- Vintage concentration (are we overweight 2024?)
- Currency exposure (is this EUR or USD?)
Excel answer: "Give me until Friday."
By Friday, opportunity is gone.
What I Actually Needed
Not faster data entry. Not better charts.
I needed forward-looking projections that could answer:
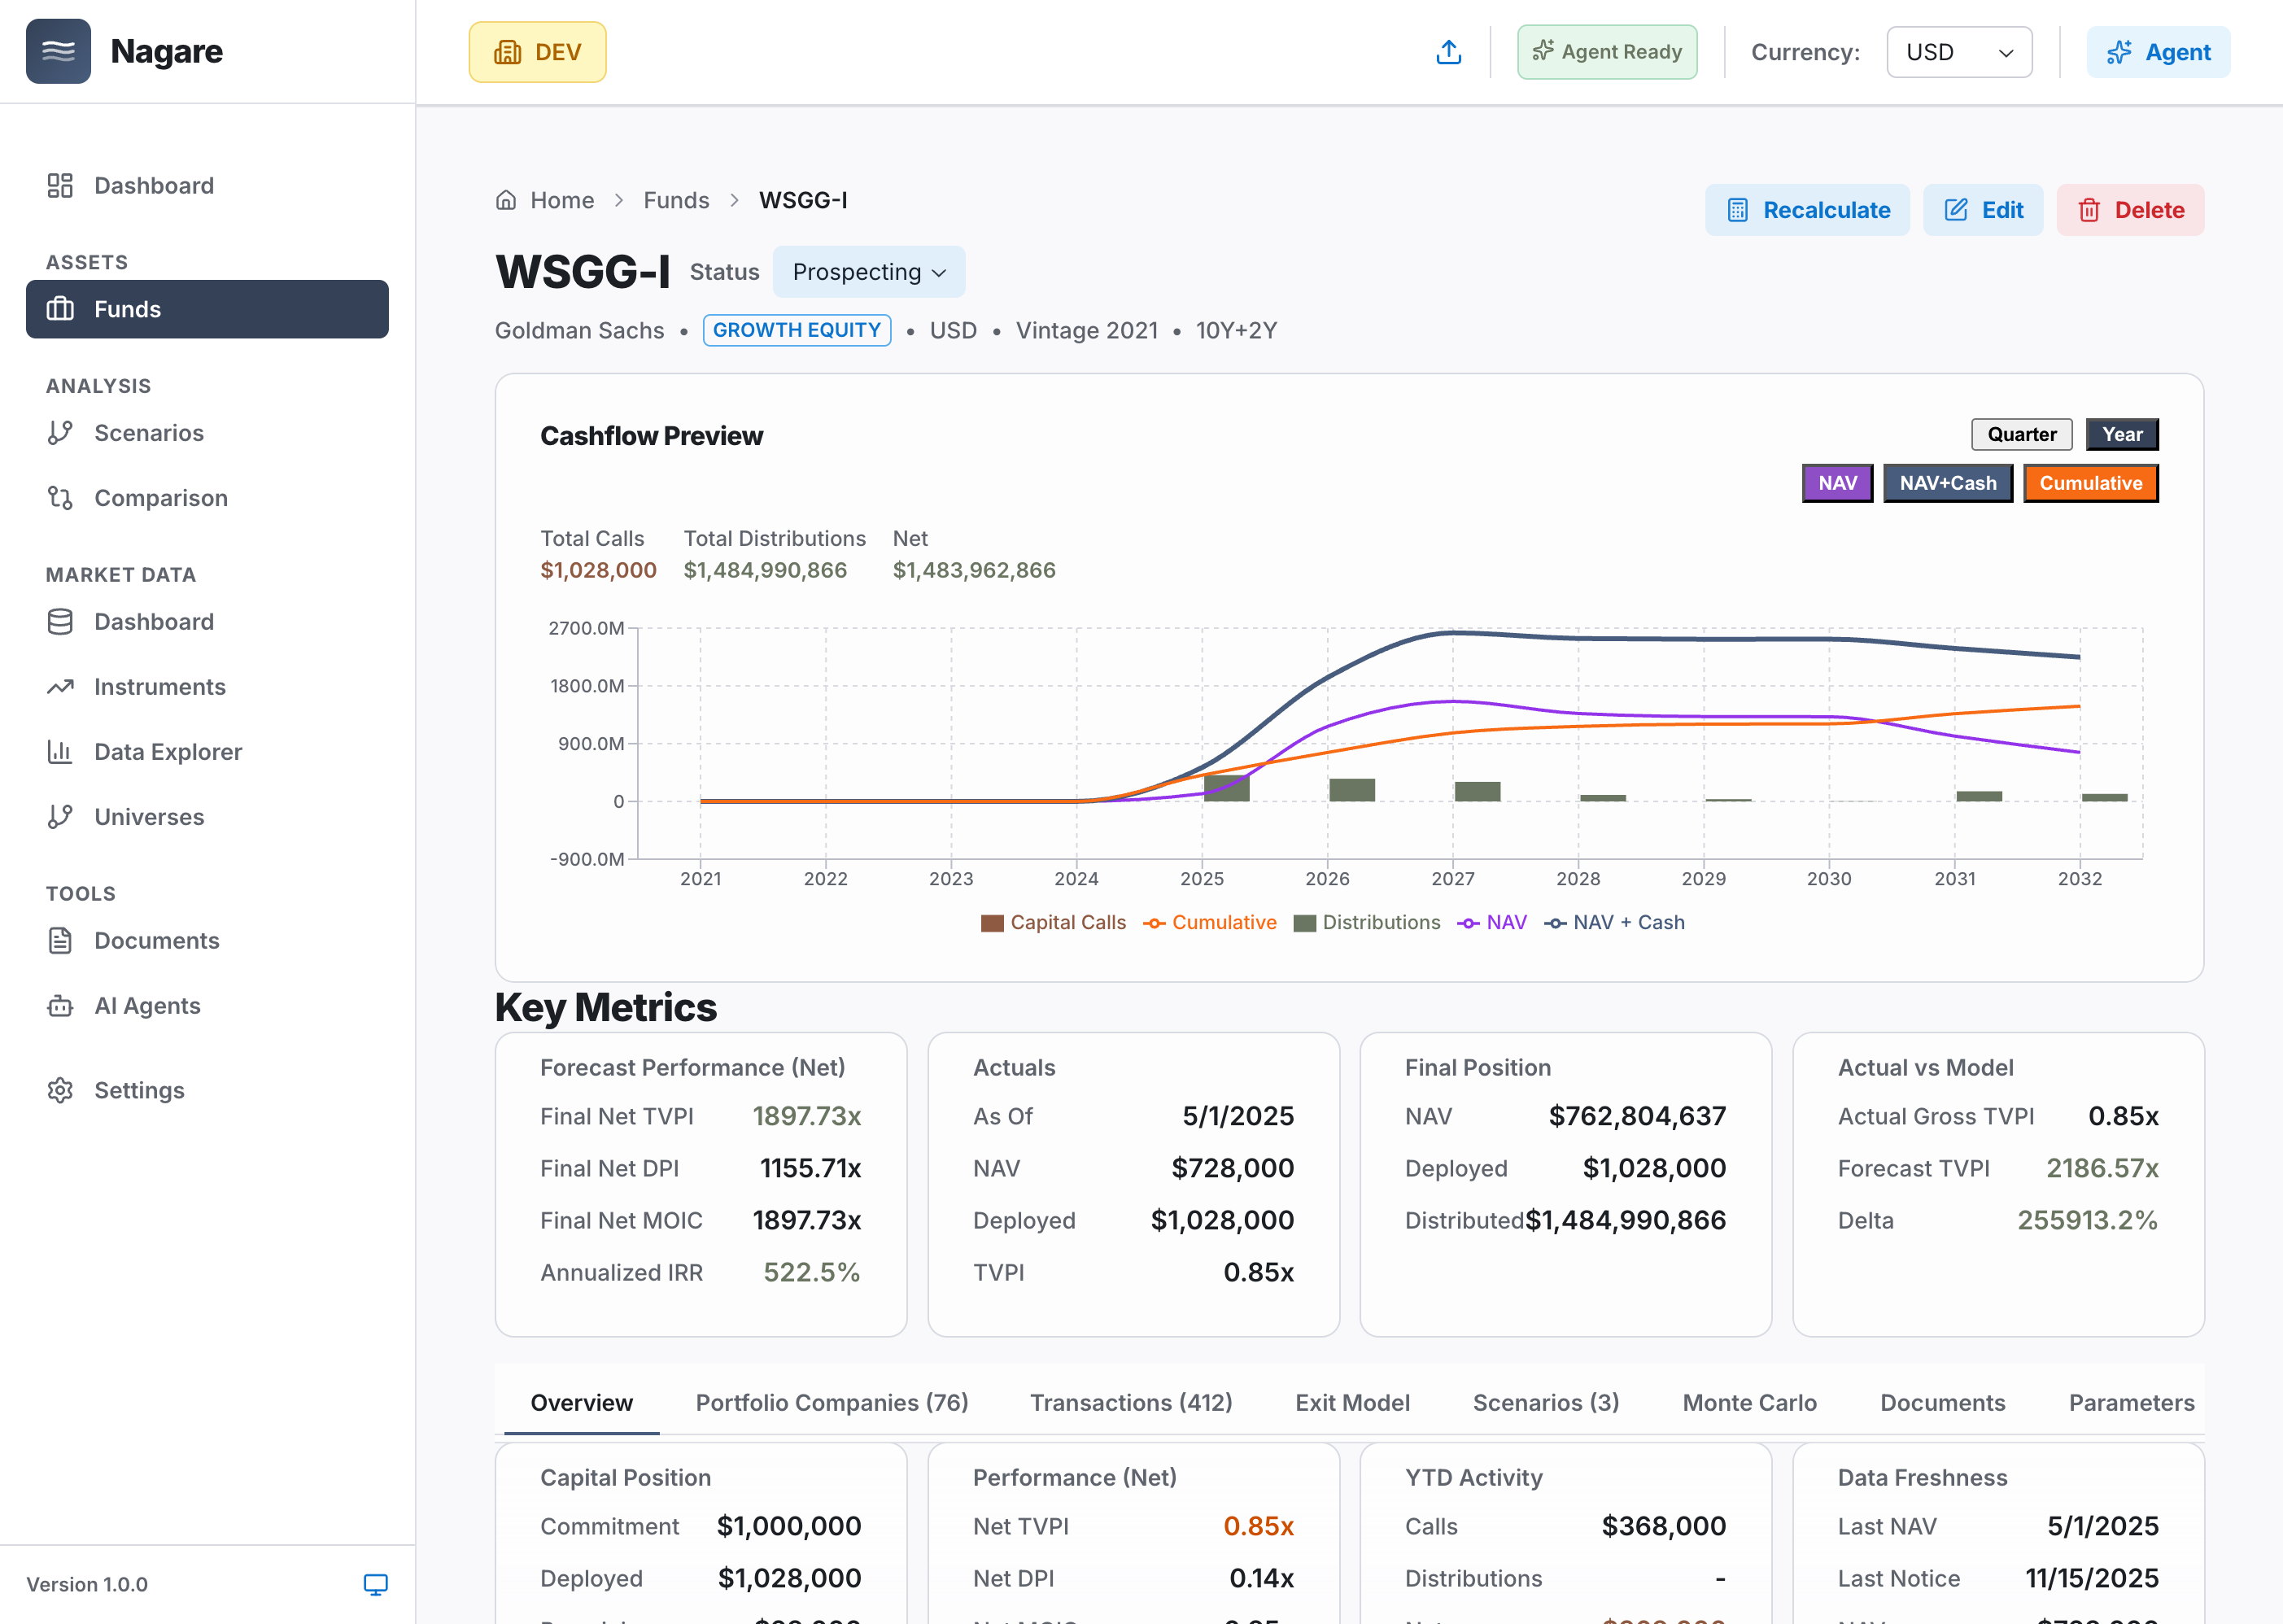 Fund-level view: Track each fund individually with capital position, cashflows, and projections
1. Current Position (Adjusted for Lag) Start with latest marks, project to today using fund-level assumptions.
2. Future Trajectory (3-10 Years) Show expected NAV, distributions, capital calls at portfolio and fund level.
3. Scenario Impact (Before Committing) Add hypothetical commitment, see immediate impact on allocation, liquidity, concentration.
4. Confidence Bands (When It Matters) Monte Carlo for risk assessment—when I need to stress-test assumptions.
5. Liquidity Forecast (Next 2 Years) Quarterly cashflows per fund, rolled up to portfolio. Know when I have capacity.
How I Think About It Now
Actuals = Foundation
Latest marks are the baseline. They're accurate historical data.
Projections = Bridge to Today
Apply fund-level assumptions (deployment curves, exit timing, growth rates, fees) to project from last mark date to today.
This gives you a current view instead of 7-month-old snapshot.
Forecasts = Planning Tool
Extend projections 3-10 years forward to see where you're heading.
This lets you plan commitments instead of reacting to opportunities.
Scenarios = Decision Support
Model "what if we commit $5M?" instantly.
This lets you answer IC questions in real-time instead of days later.
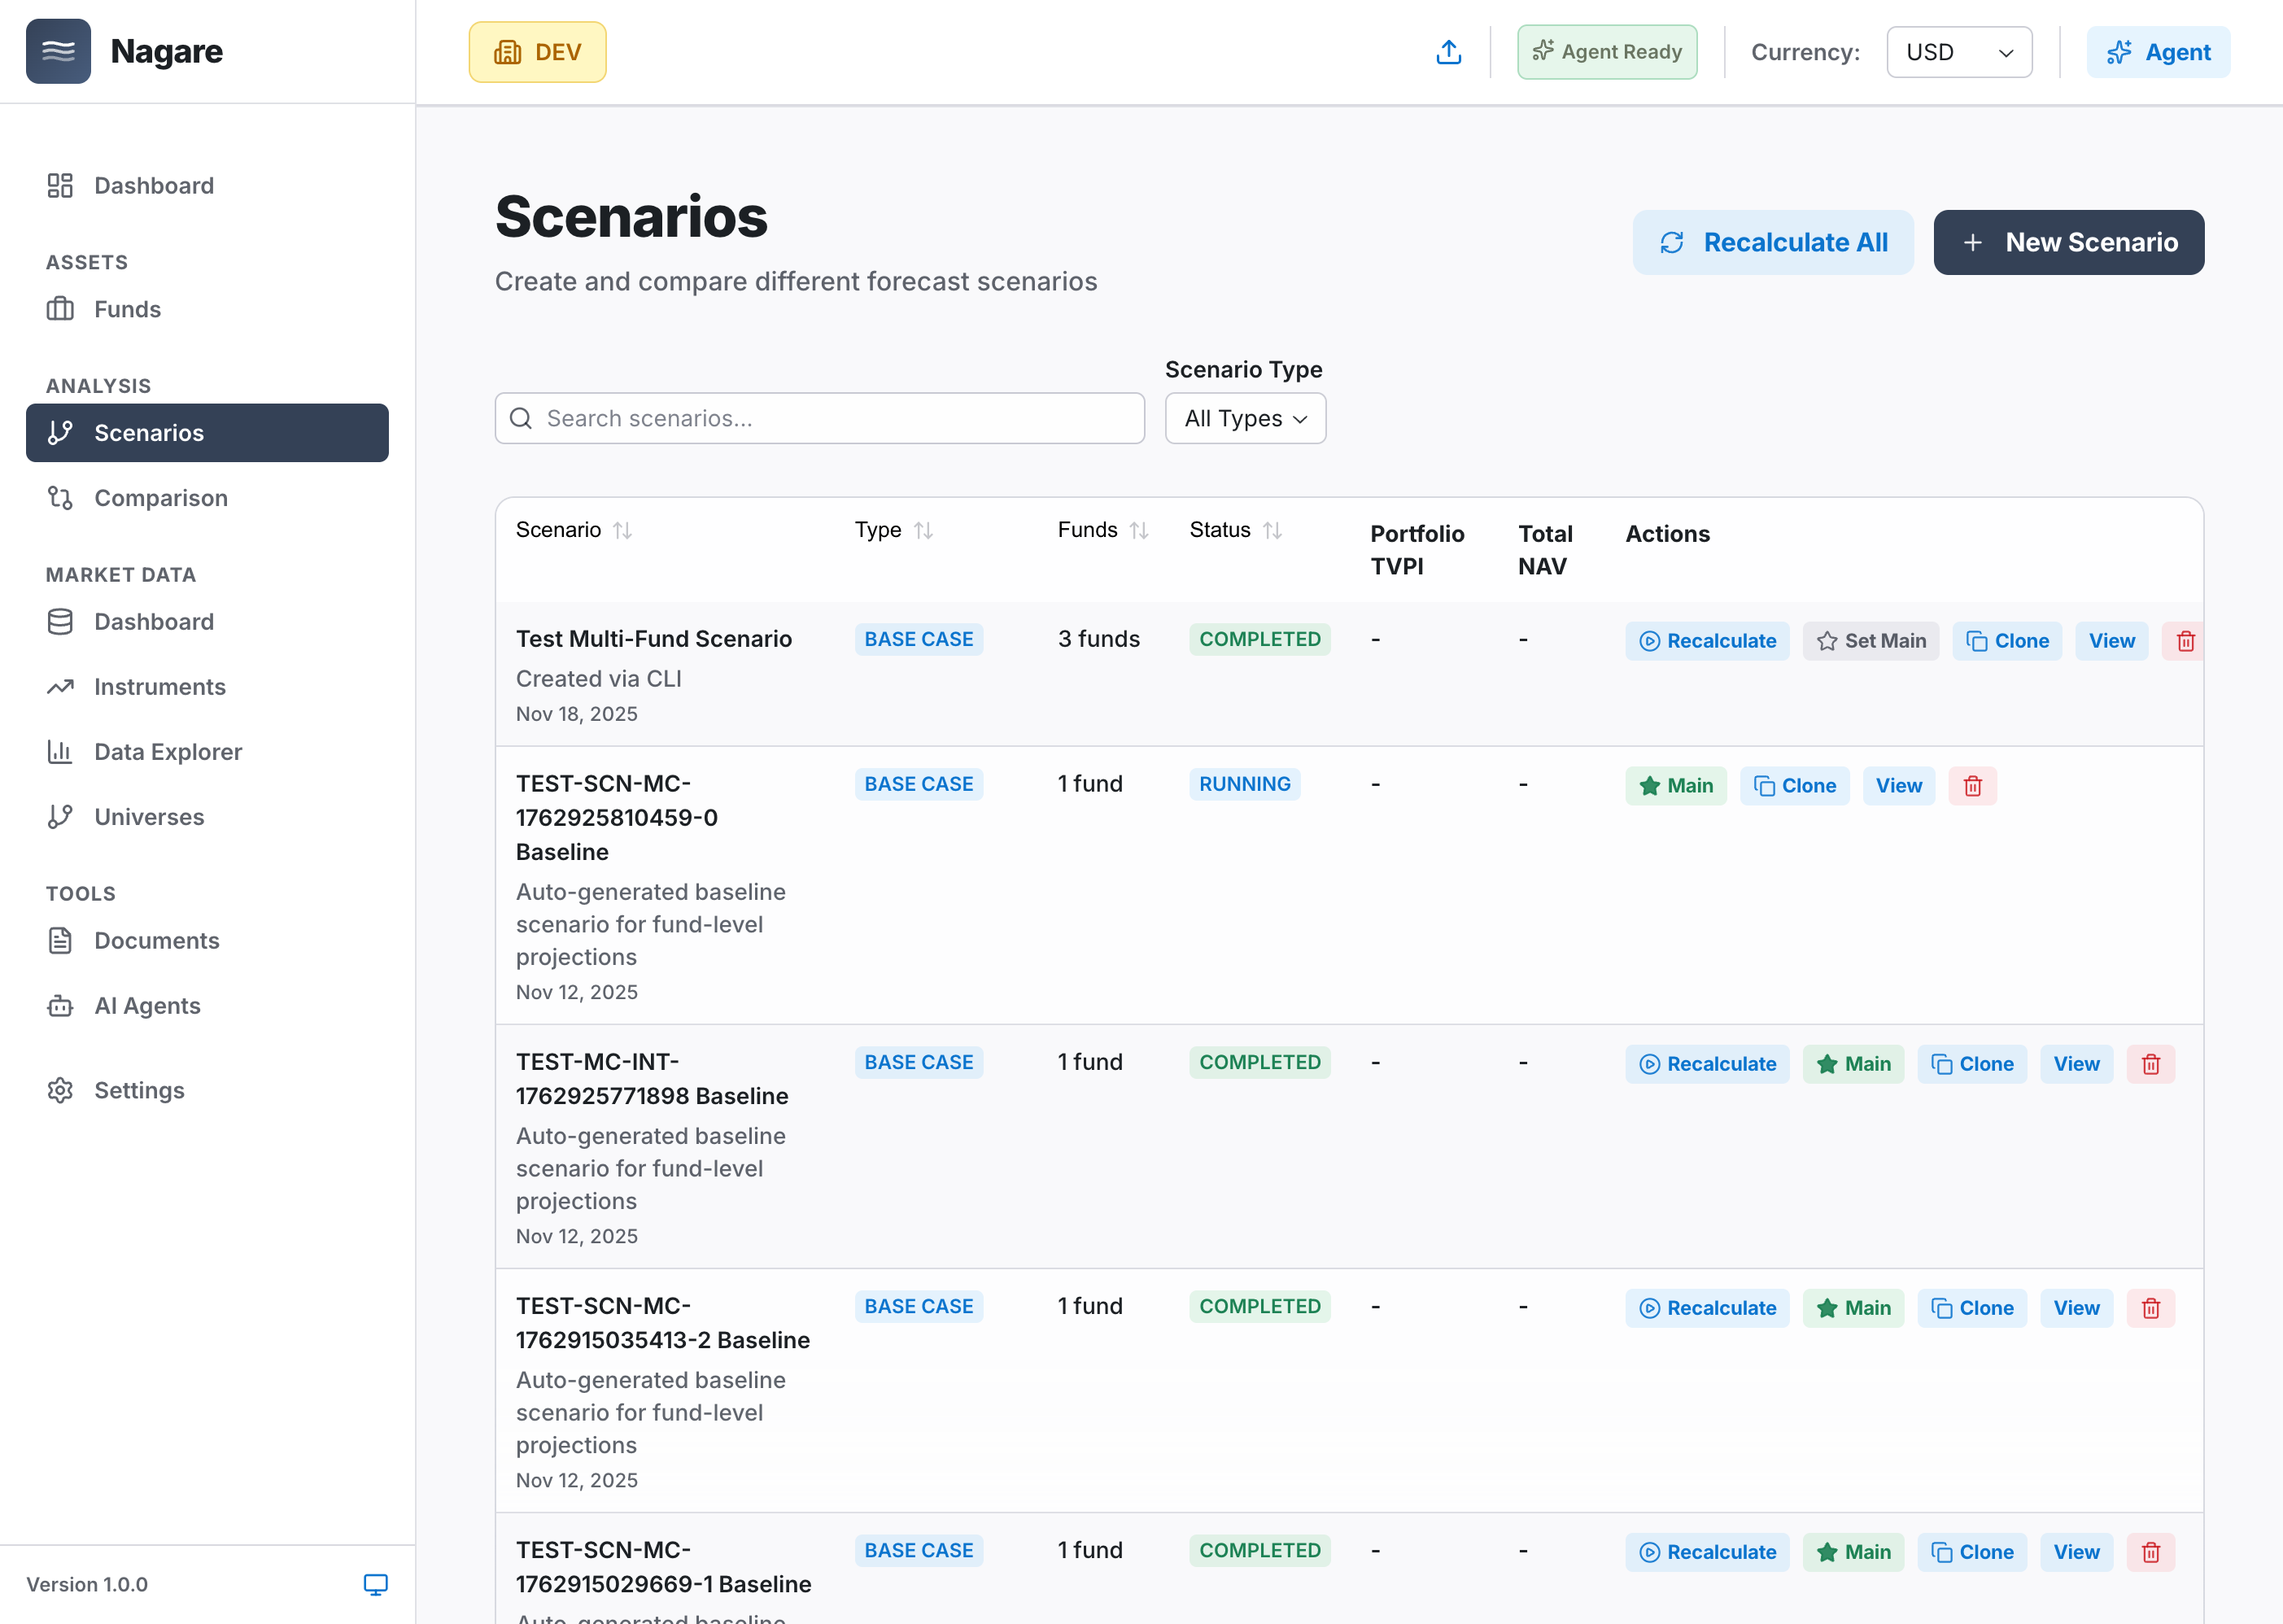 Create and compare scenarios: Base Case, Bull Case, Bear Case, Stress Test - all in 30 seconds
Monte Carlo = Risk Management
When you need confidence intervals and tail risk analysis.
Not for every decision—only when uncertainty really matters.
Why This Matters for Building Wealth
Private markets are long-term.
You're making commitments today that will play out over 10-15 years.
You're building a portfolio across vintages, strategies, geographies, currencies.
If you can't see where you're heading, you're guessing.
Good guessing is still guessing.
What Changed When I Could See Forward
I stopped missing opportunities
IC asks about a deal. I model it in 30 seconds. We make informed decisions while we're still in the meeting.
I stopped over-committing
I know my liquidity profile for the next 2 years. I know when I have capacity. I don't commit blindly and scramble for cash later.
I stopped worrying about concentration
I can see vintage × strategy × geography exposure in real-time. I know if I'm accidentally getting too concentrated in 2024 vintage buyout.
I started planning strategically
"We want 35% PE exposure." Okay, what do we need to commit to over the next 18 months to get there? I can answer that now.
The Point
You don't need better spreadsheets.
You need a forward-looking view that helps you build wealth strategically instead of reacting to whatever crosses your desk.
That's why I built this.
If you're managing multiple private fund commitments and asking the same questions I was, maybe it'll help you too.
Want to see what forward-looking projections look like for your portfolio? Request a demo and we'll walk through it together.
Ready to Transform Your Portfolio Management?
See how Nagare can eliminate manual work and accelerate decision-making.
Related Articles
The $2M Reconciliation Error That Changed How We Think About Cash
A single missed transaction created a $2M hole in a client's cash forecast. We rebuilt our system so it can never happen...
Stop Chasing Spreadsheets: Introducing Agent Schedules
Manual portfolio monitoring at scale is impossible. Our new Agent Schedules feature deploys 6 AI agents that run 24/7, c...